
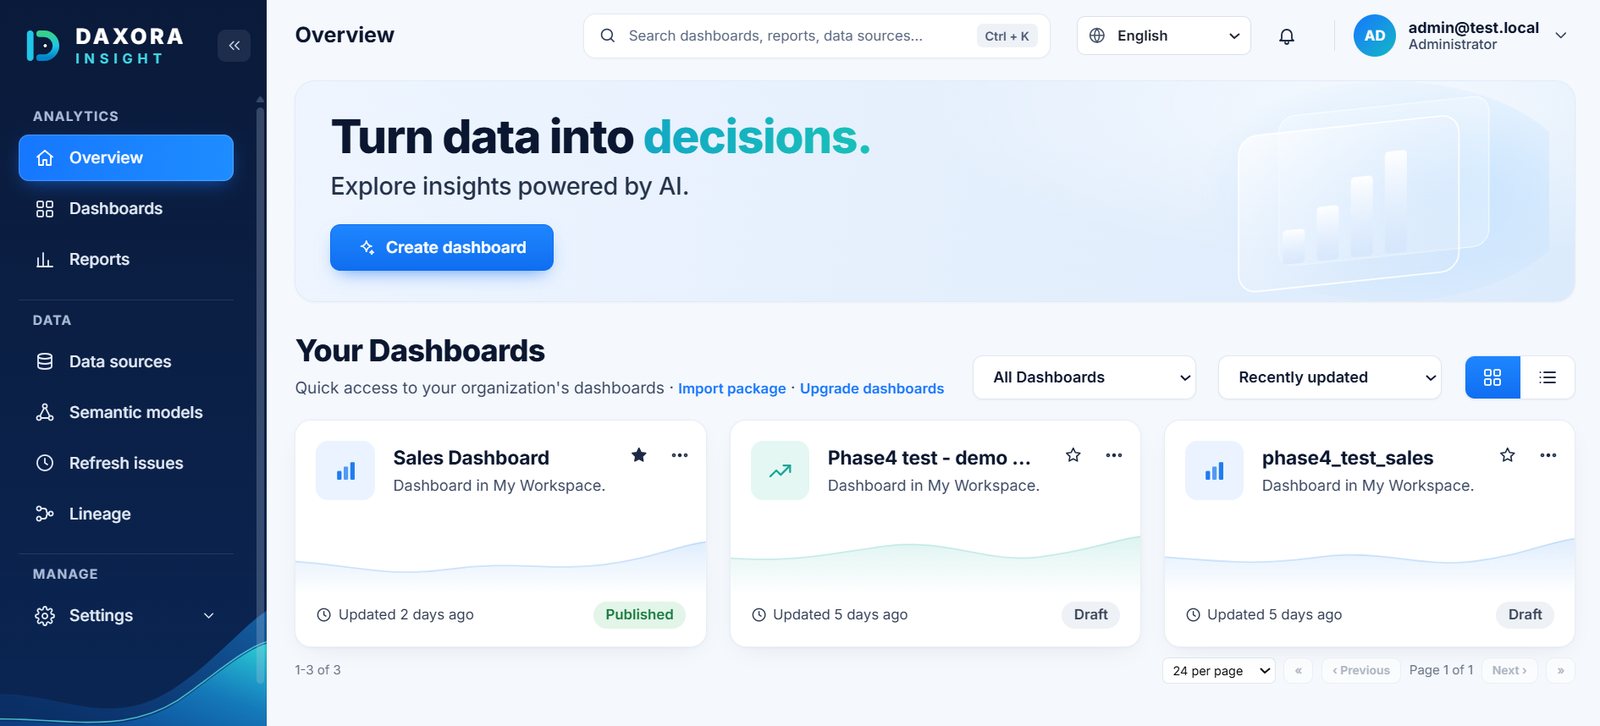
DAXORA Insight
Turn your data into dashboards in minutes.
Generate interactive dashboards, explore insights and forecast outcomes using AI.
Explore DAXORA Insight Show demoAI-powered analytics
Connect your data, discover insights, and automate your analytics with AI.
Revenue by emirate Q3 · United Arab Emirates
Dubai
Emirate boundaries © OpenStreetMap contributors (ODbL), via geoBoundaries
Revenue by region Q3 · growth vs Q2
Revenue by sales channel Dubai · Q3
Product mix Dubai · share of revenue
Monthly revenue Dubai · Q3 highlighted
Online is Dubai's largest channel at 41.9% of revenue, and Q3 was its strongest quarter so far.
Revenue forecast Actual Forecast 80% interval
Illustrative forecast with an 80% prediction interval
Which region has the strongest growth?
Sharjah has the strongest growth: +21.3% on Q2, to $0.74M (+$130K). Dubai is still the largest emirate at 38.6% of revenue, so Sharjah is the strongest opportunity for expansion.
Growth vs Q2 by emirate
Based on: Revenue, Emirate, Order date
Recommended actions
Suggested questions
Product mix UAE · Q3
Revenue by channel Q1 to Q3
Revenue heatmap Emirate by month · Q3
LowerHigher
Q3 target attainment
$4.82M of a $5.02M target
Use them together or on their own.
Turn your data into dashboards in minutes.
Generate interactive dashboards, explore insights and forecast outcomes using AI.
Explore DAXORA Insight Show demo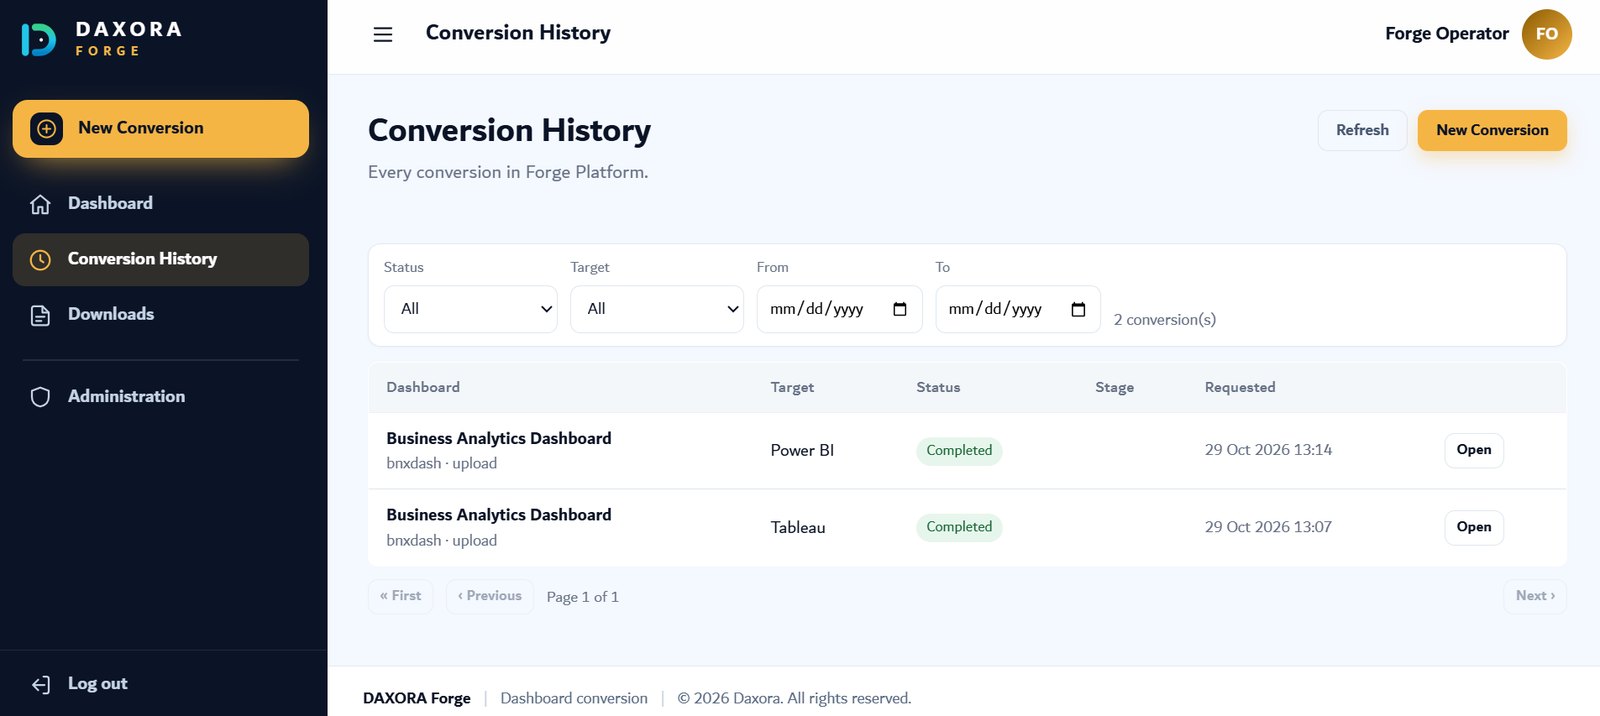
Build native BI reports faster.
Generate and migrate BI assets across supported reporting platforms.
Explore DAXORA Forge Show demo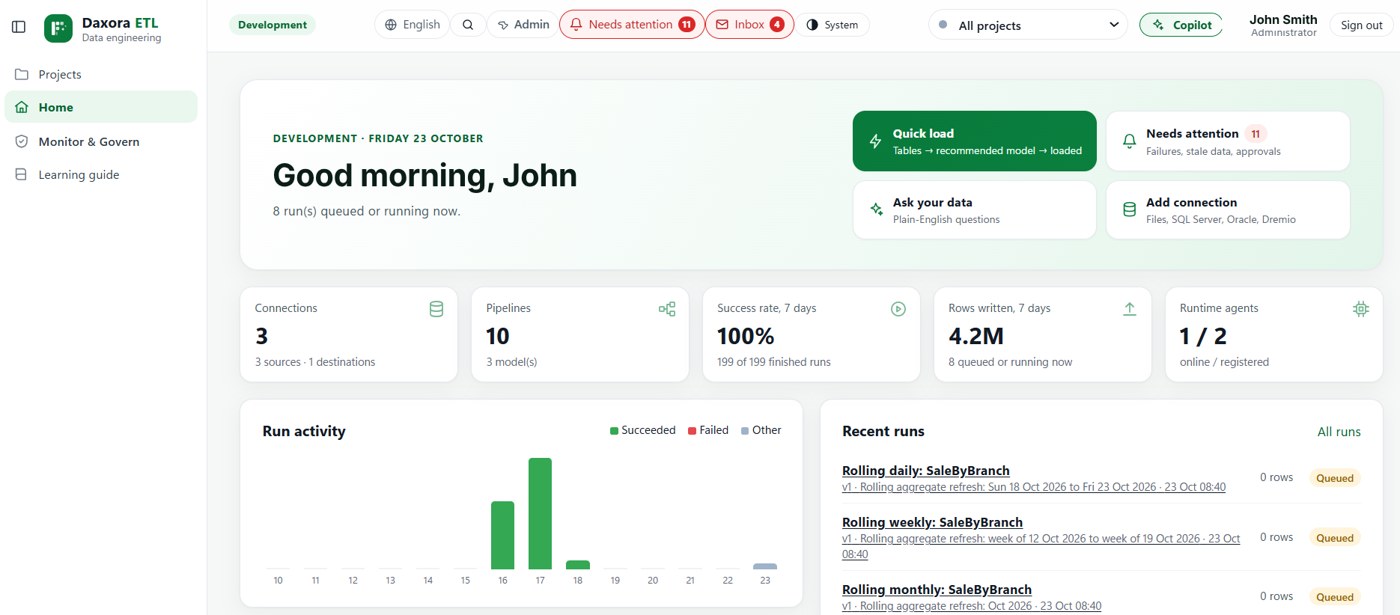
Prepare and automate your data.
Connect, clean, transform and build intelligent data pipelines with AI.
Explore DAXORA Studio Show demoIntelligent data solutions designed to make analytics faster, simpler and more accessible.
Excel, CSV or a database
DAXORA builds it for you
Charts, KPIs and filters, ready to share
Turn connected data into useful dashboards in minutes.
Use AI to assist with data preparation, dashboard creation and advanced analysis.
Support enterprise deployment, security and governance requirements.
Use DAXORA Studio, Insight and Forge individually or together, where supported.
Turn enterprise data into dashboards, reports and answers with AI-assisted analytics.
Generate native BI dashboards and accelerate migration between supported enterprise reporting platforms.
Platform and conversion support is expanded as each path is implemented and validated.
Connect data, automate ETL pipelines and build predictive models in one workspace.
DATA SOURCES
Platform targets are shown where implemented and validated.
Simulated demonstration with illustrative data. Not a live AI execution or production output.
Description of the demonstration: data from SQL Server, Oracle, Excel and CSV files, APIs and cloud databases flows into the DAXORA AI Intelligence Engine. The engine feeds three independent products. DAXORA Studio discovers data, designs transformations, generates ETL pipelines and builds predictive models. DAXORA Insight generates KPIs, creates dashboards, analyzes trends and forecasts outcomes. DAXORA Forge generates native BI reports, converts supported BI assets and supports Power BI, Qlik Sense and Tableau where implemented and validated. Insight and Forge do not require Studio.
Studio prepares and models the data. Insight turns it into dashboards and answers. Each product also works on its own.
Databases, files, APIs and cloud sources.
Profiling, relationships and ETL/ELT pipelines.
Trusted, analysis-ready tables on a schedule.
Train, compare and publish predictions.
AI-selected KPIs and interactive charts.
Ask questions, run what-ifs, share insight.
Prepare data and build models for any downstream tool.
Validated data and models from Studio feed Insight dashboards and forecasts.
Connects directly to supported data sources. Studio is not required.
DAXORA Forge is a separate product outside this flow: it generates and migrates native BI reports for supported reporting platforms.
Data sources on one side, reports and BI platforms on the other.
Tested end to end
Available, validated during setup
Exports from DAXORA Insight
BI platforms for DAXORA Forge, supported paths confirmed per project
Product names are trademarks of their respective owners. DAXORA is not affiliated with them.
DAXORA Insight installs on your own Windows Server and IIS, inside your network. Hosted and cloud options are agreed per project.
Connect Insight to OpenAI, Azure OpenAI or an organization-hosted, OpenAI-compatible model (Enterprise licence). AI features can also be turned off.
SQL Server, PostgreSQL, ODBC sources and Excel/CSV files are tested end to end. Other supported databases are validated during setup.
Roles, permission groups, dashboard sharing and row-level security. Single sign-on through OpenID Connect is set up by configuration.
An audit trail of sign-ins, role changes, publishing and schedules, with dashboard version history and rollback.
Load-tested on a single server. Sizing for larger user numbers and data volumes is planned with your team.
Scheduled email delivery, embedding, and export to Excel, CSV, PDF, PowerPoint and PNG. Microsoft Teams delivery by configuration.
Status reflects the current DAXORA Insight release. Studio and Forge specifics are confirmed during your evaluation.